UC Berkeley · ZoneZero
Pre-Eaton Fire Zone Zero Risks
Model evaluation
Fixed validation results
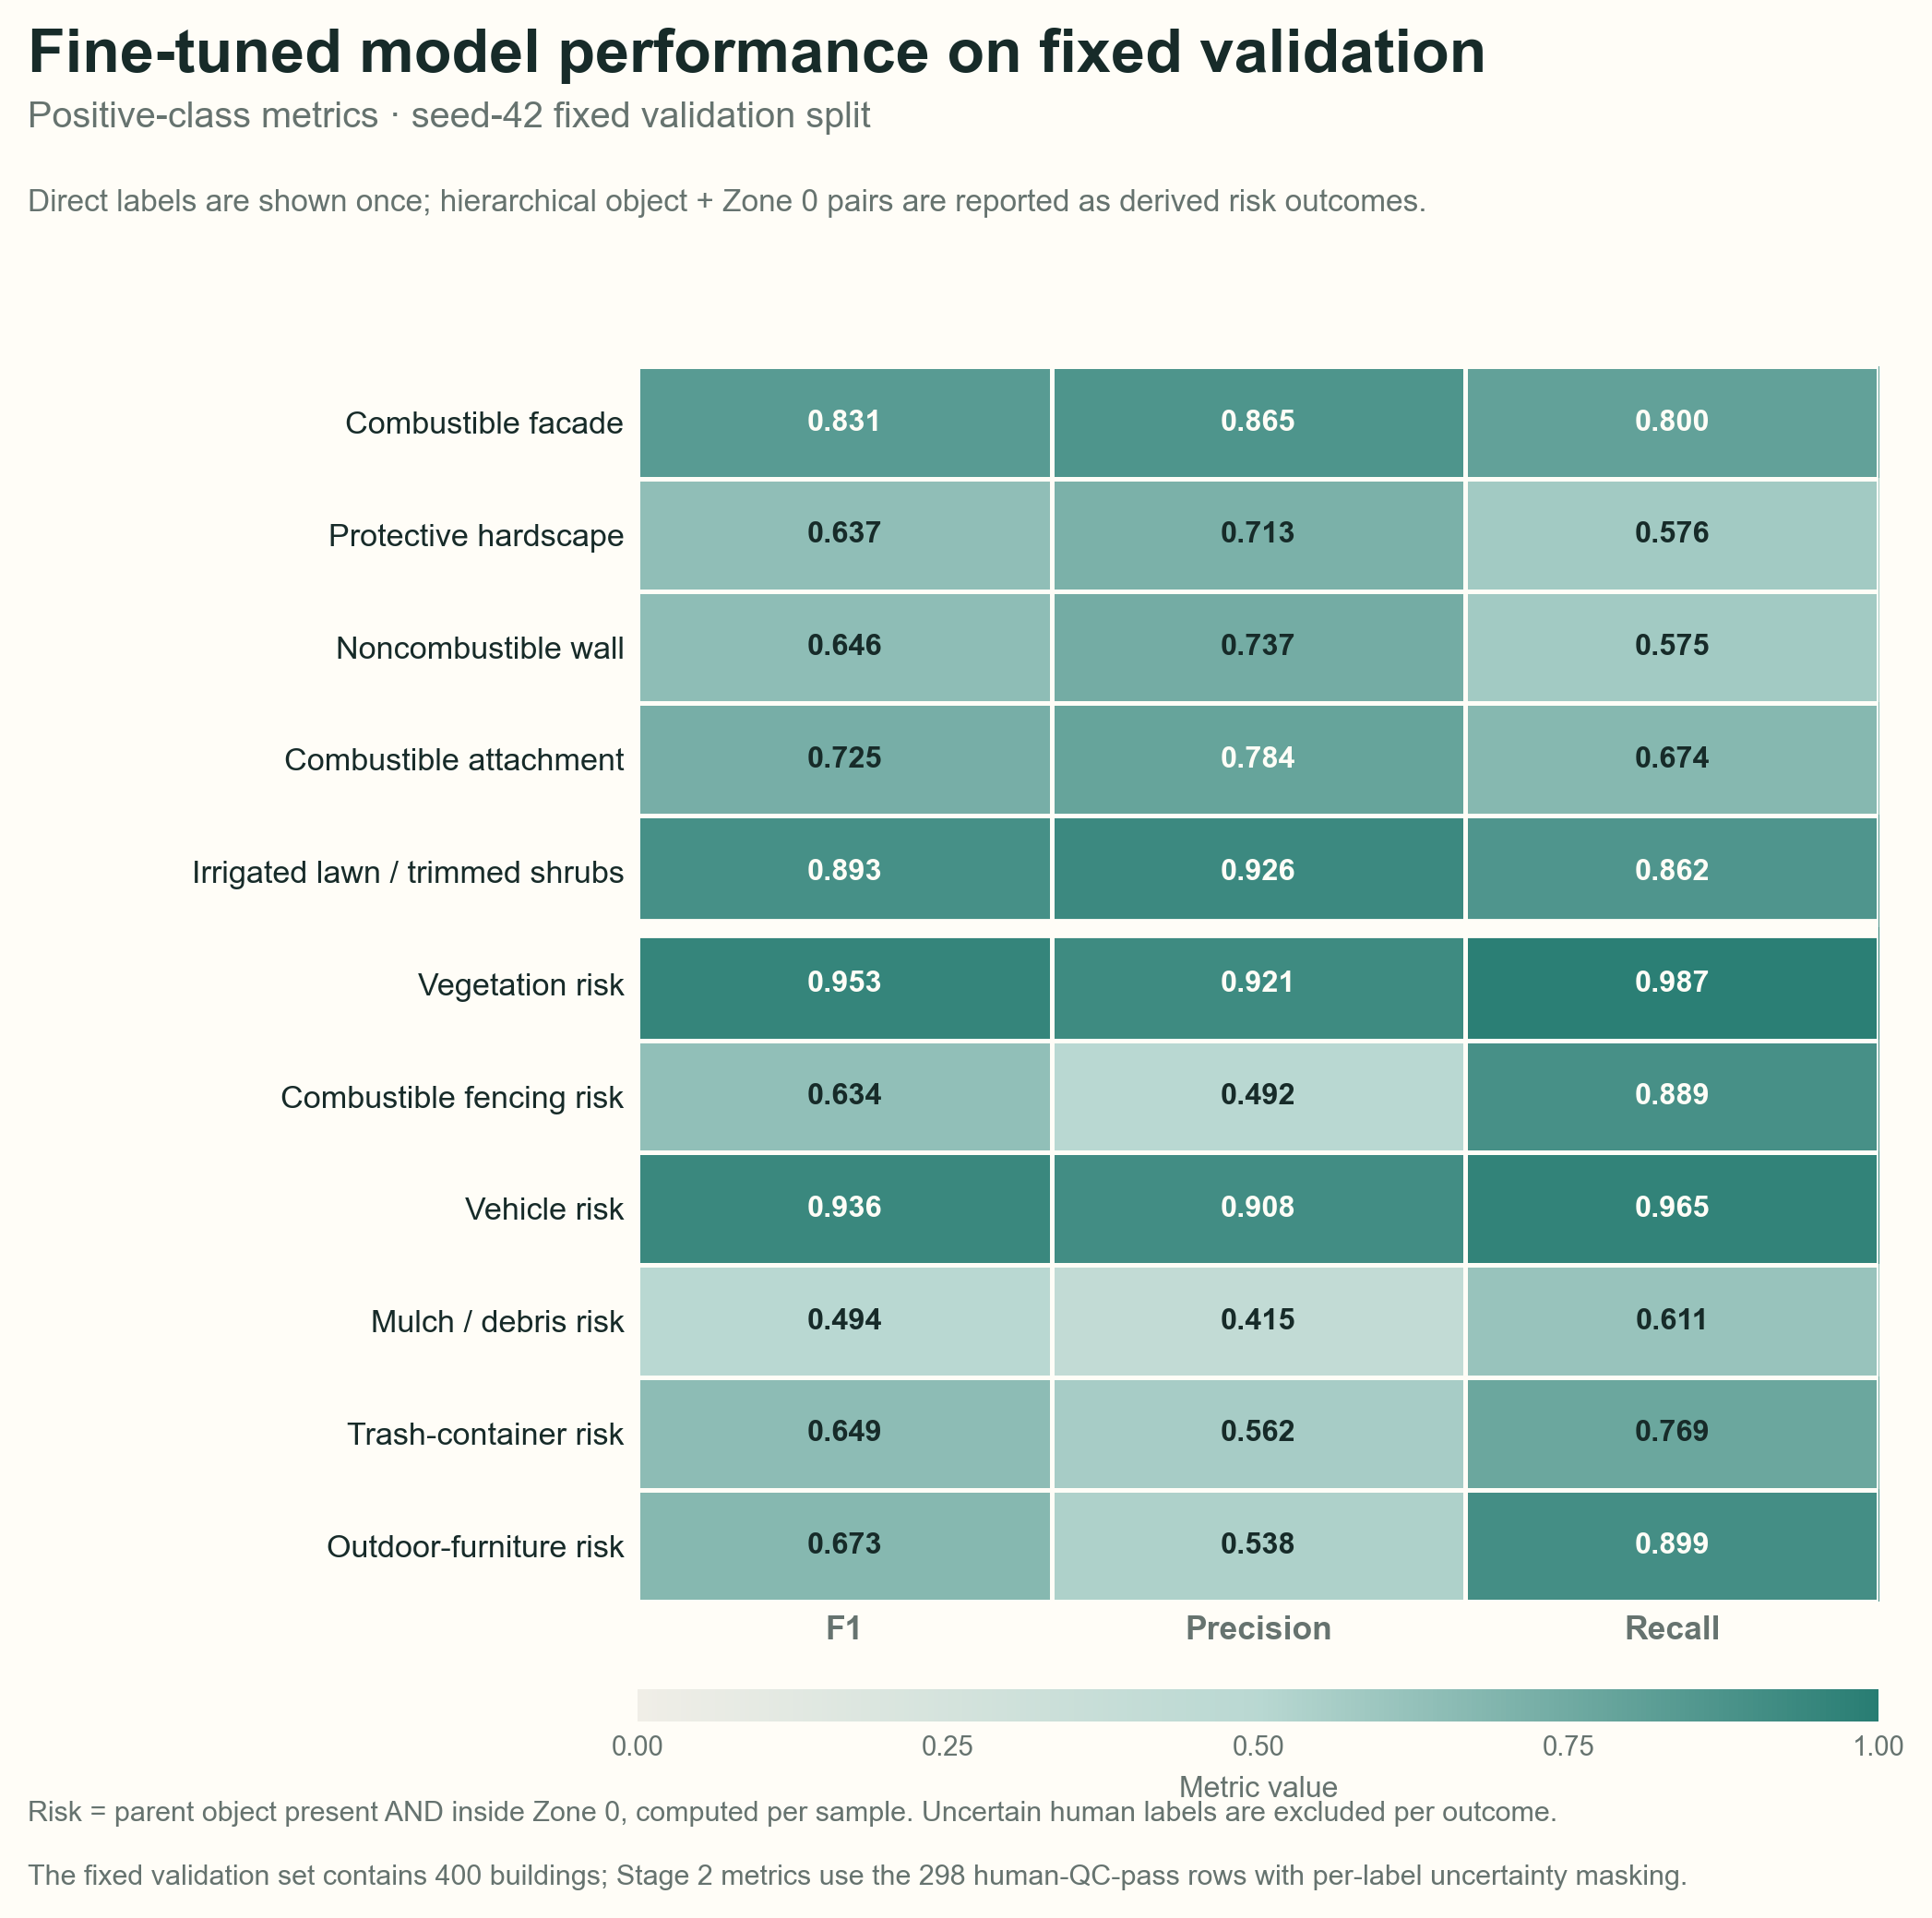
Final fine-tuned model performance on the fixed seed-42 validation split: 400 buildings for Stage 1 and 298 human-QC-pass buildings for Stage 2. The six hierarchical outcomes are reported only as Boolean Zone 0 risk labels.
Fine-tuned model
Per-label validation performance
Evaluation scopeAll 400 validation buildings400 evaluated · 0 excluded for this outcome
Confusion matrix
Stage 1 visual QC
Model predictionGround truthNegativePositiveNegativePositive
All outcomes
Final validation metrics
| Outcome | F1 | Precision | Recall | Max validation F1Precision / Recall | Evaluated | Excluded |
|---|---|---|---|---|---|---|
| 0.915 | 0.905 | 0.926 | 0.9160.919 / 0.913 | 400 | 0 | |
| 0.831 | 0.865 | 0.800 | 0.8330.795 / 0.875 | 197 | 101 | |
| 0.637 | 0.713 | 0.576 | 0.6700.636 / 0.707 | 284 | 14 | |
| 0.646 | 0.737 | 0.575 | 0.6890.579 / 0.849 | 288 | 10 | |
| 0.725 | 0.784 | 0.674 | 0.7470.775 / 0.721 | 263 | 35 | |
| 0.893 | 0.926 | 0.862 | 0.9090.888 / 0.931 | 296 | 2 | |
| 0.953 | 0.921 | 0.987 | 0.9640.970 / 0.958 | 281 | 17 | |
| 0.634 | 0.492 | 0.889 | 0.7370.700 / 0.778 | 233 | 65 | |
| 0.936 | 0.908 | 0.965 | 0.9560.948 / 0.965 | 287 | 11 | |
| 0.494 | 0.415 | 0.611 | 0.5640.524 / 0.611 | 245 | 53 | |
| 0.649 | 0.562 | 0.769 | 0.7420.780 / 0.708 | 285 | 13 | |
| 0.673 | 0.538 | 0.899 | 0.7400.760 / 0.722 | 239 | 59 |
Threshold-tuned values maximize positive-class F1 on this same fixed validation split; the associated precision and recall appear below each F1. They are apparent validation results, not independent test estimates. Derived risk rows jointly tune the parent and conditional Zone 0 margins under the prompt-v3 scoring contract. Hover a value to see its selected threshold.
Final-model diagnostic
Trainval Diagnostic Atlas
Full confusion matrices for the 2,000-building labeled trainval pool, with representative high-confidence examples from each cell. This is an in-sample error-analysis view for model diagnosis and prompt refinement; it is not a validation or held-out performance estimate.
Loading the audited trainval diagnostic atlas…