UC Berkeley · ZoneZero
Pre-Eaton Fire Zone Zero Risks
Pre-Eaton analysis
Held-out test performance and population inference summary
Locked test-set comparisons for four model settings and audited inference summaries for 55,608 study buildings. Building-level results are available on the interactive map.
Study coverage
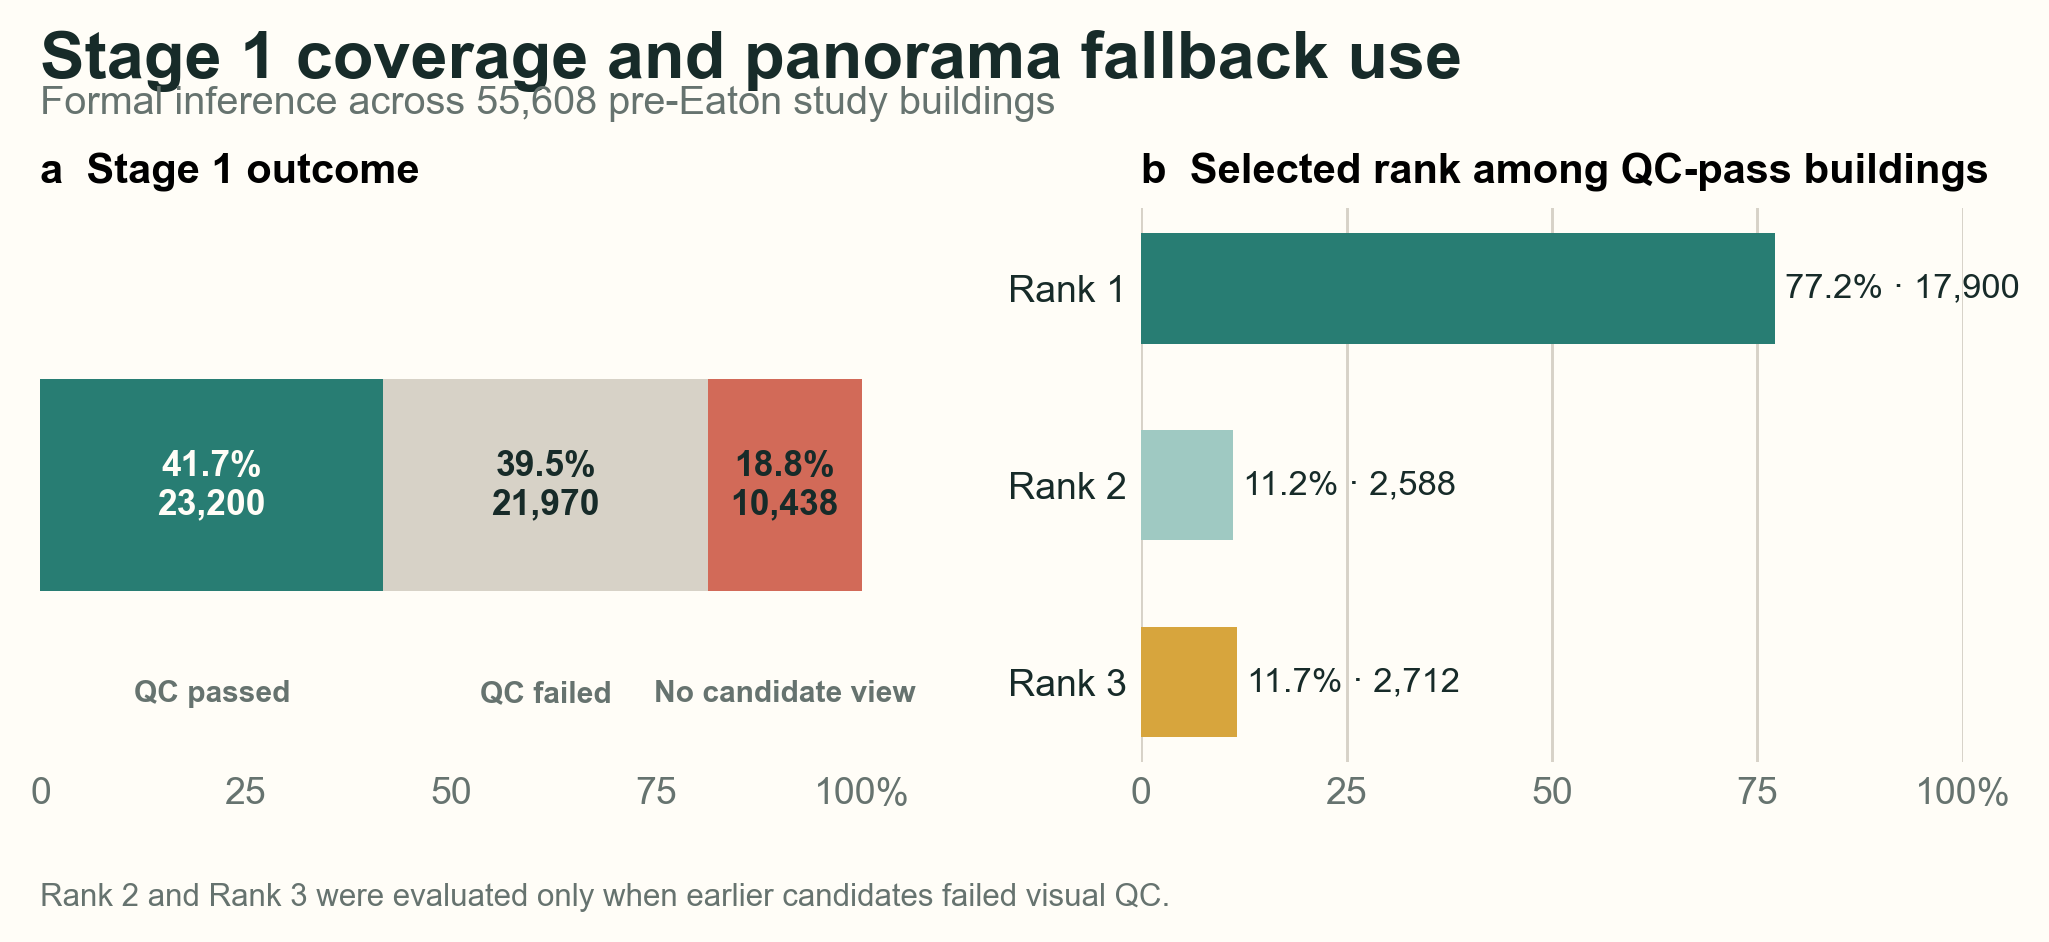
Building and parcel populations
| Research unit | Study total | QC passed | No SVI | No building |
|---|---|---|---|---|
| Building | 55,608 | 23,200 (41.7%) | 10,438 (18.8%) | — |
| Parcel | 34,940 | 17,984 (51.5%) | 4,365 (12.5%) | 2,998 (8.6%) |
Model evaluation
Held-out test performance
ModelSettingStage 1 F1Stage 2 macro-F1Stage 2 macro precisionStage 2 macro recall
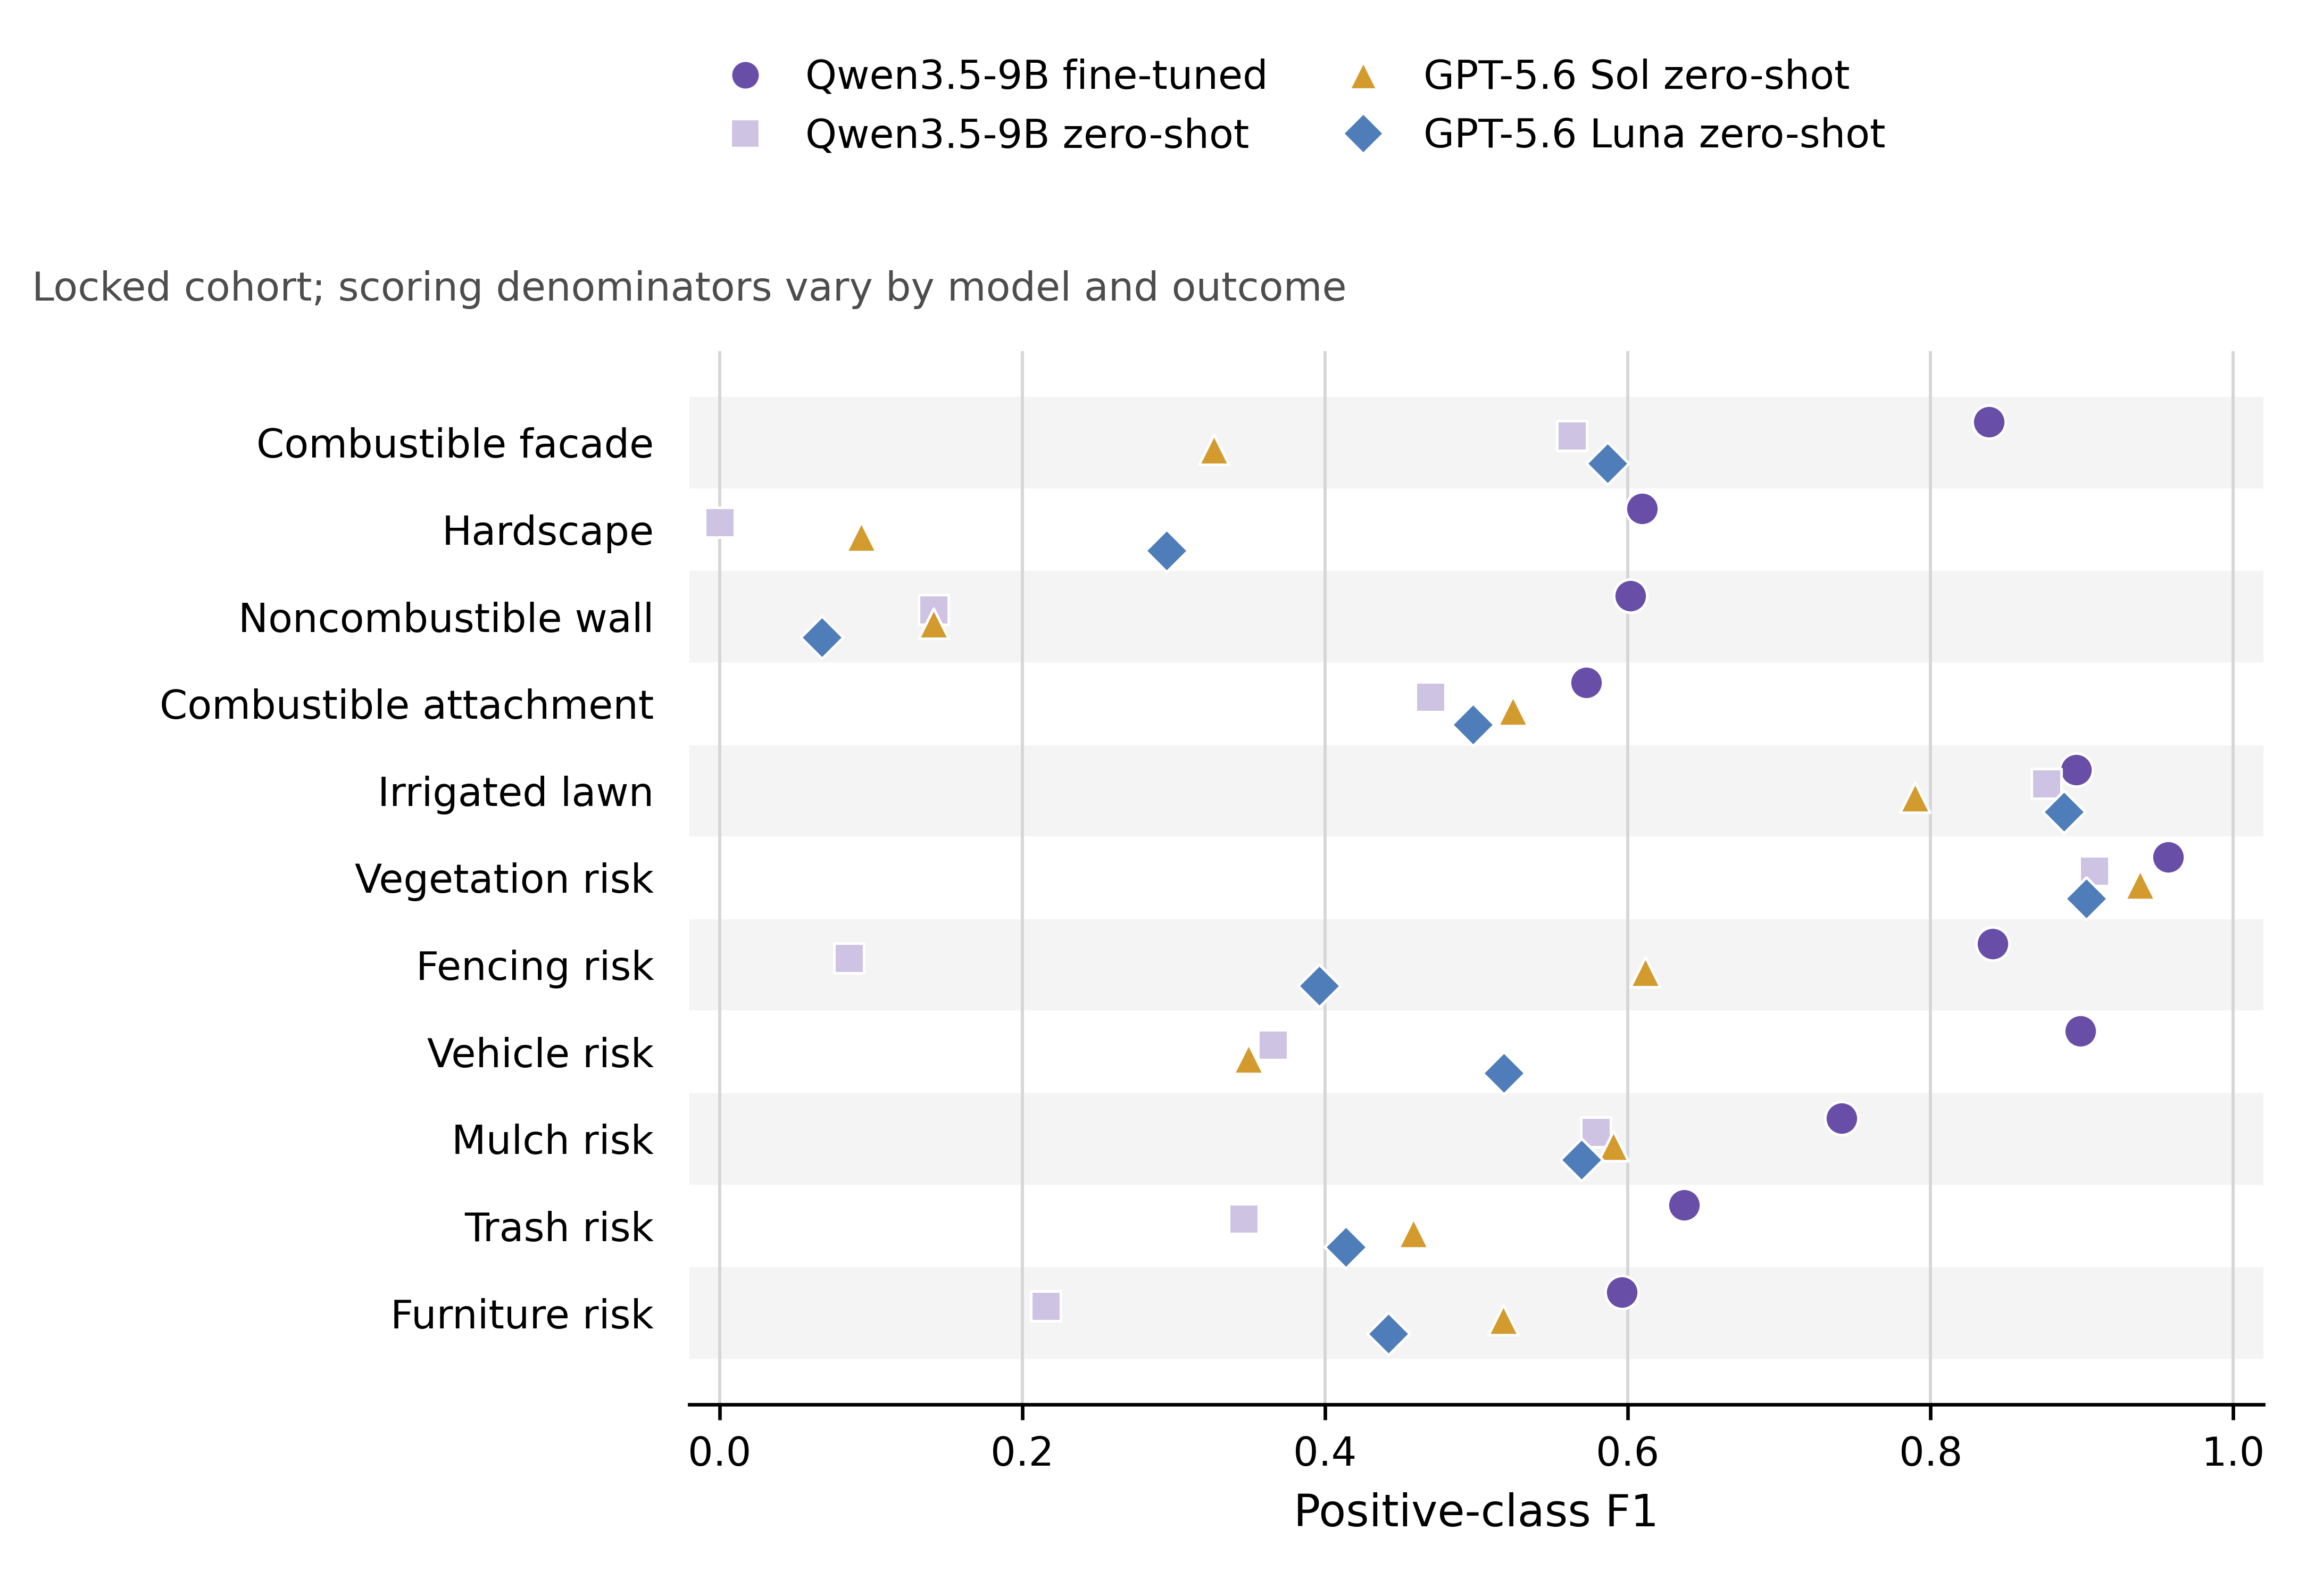
Stage 1 uses all 1,000 held-out buildings. Stage 2 uses the locked cohort of 526 human-QC-pass buildings; uncertain human labels are excluded separately by outcome and the public CSV reports the scored denominator for each model-outcome pair. Qwen fine-tuned uses the frozen threshold profile selected on validation only; zero-shot models use their native binary decisions. GPT-5.6 Sol and Luna were evaluated only for conditional Stage 2, so Stage 1 is not reported. Stage 2 F1, precision, and recall are equal-weight positive-class macros over the 11 final outcomes shown below. A dash means not reported, not zero. The best value in each metric column is bold. Sol produced five invalid structured responses, which remain penalized.
Four-model comparison
Per-label held-out performance
Formal Eaton inference
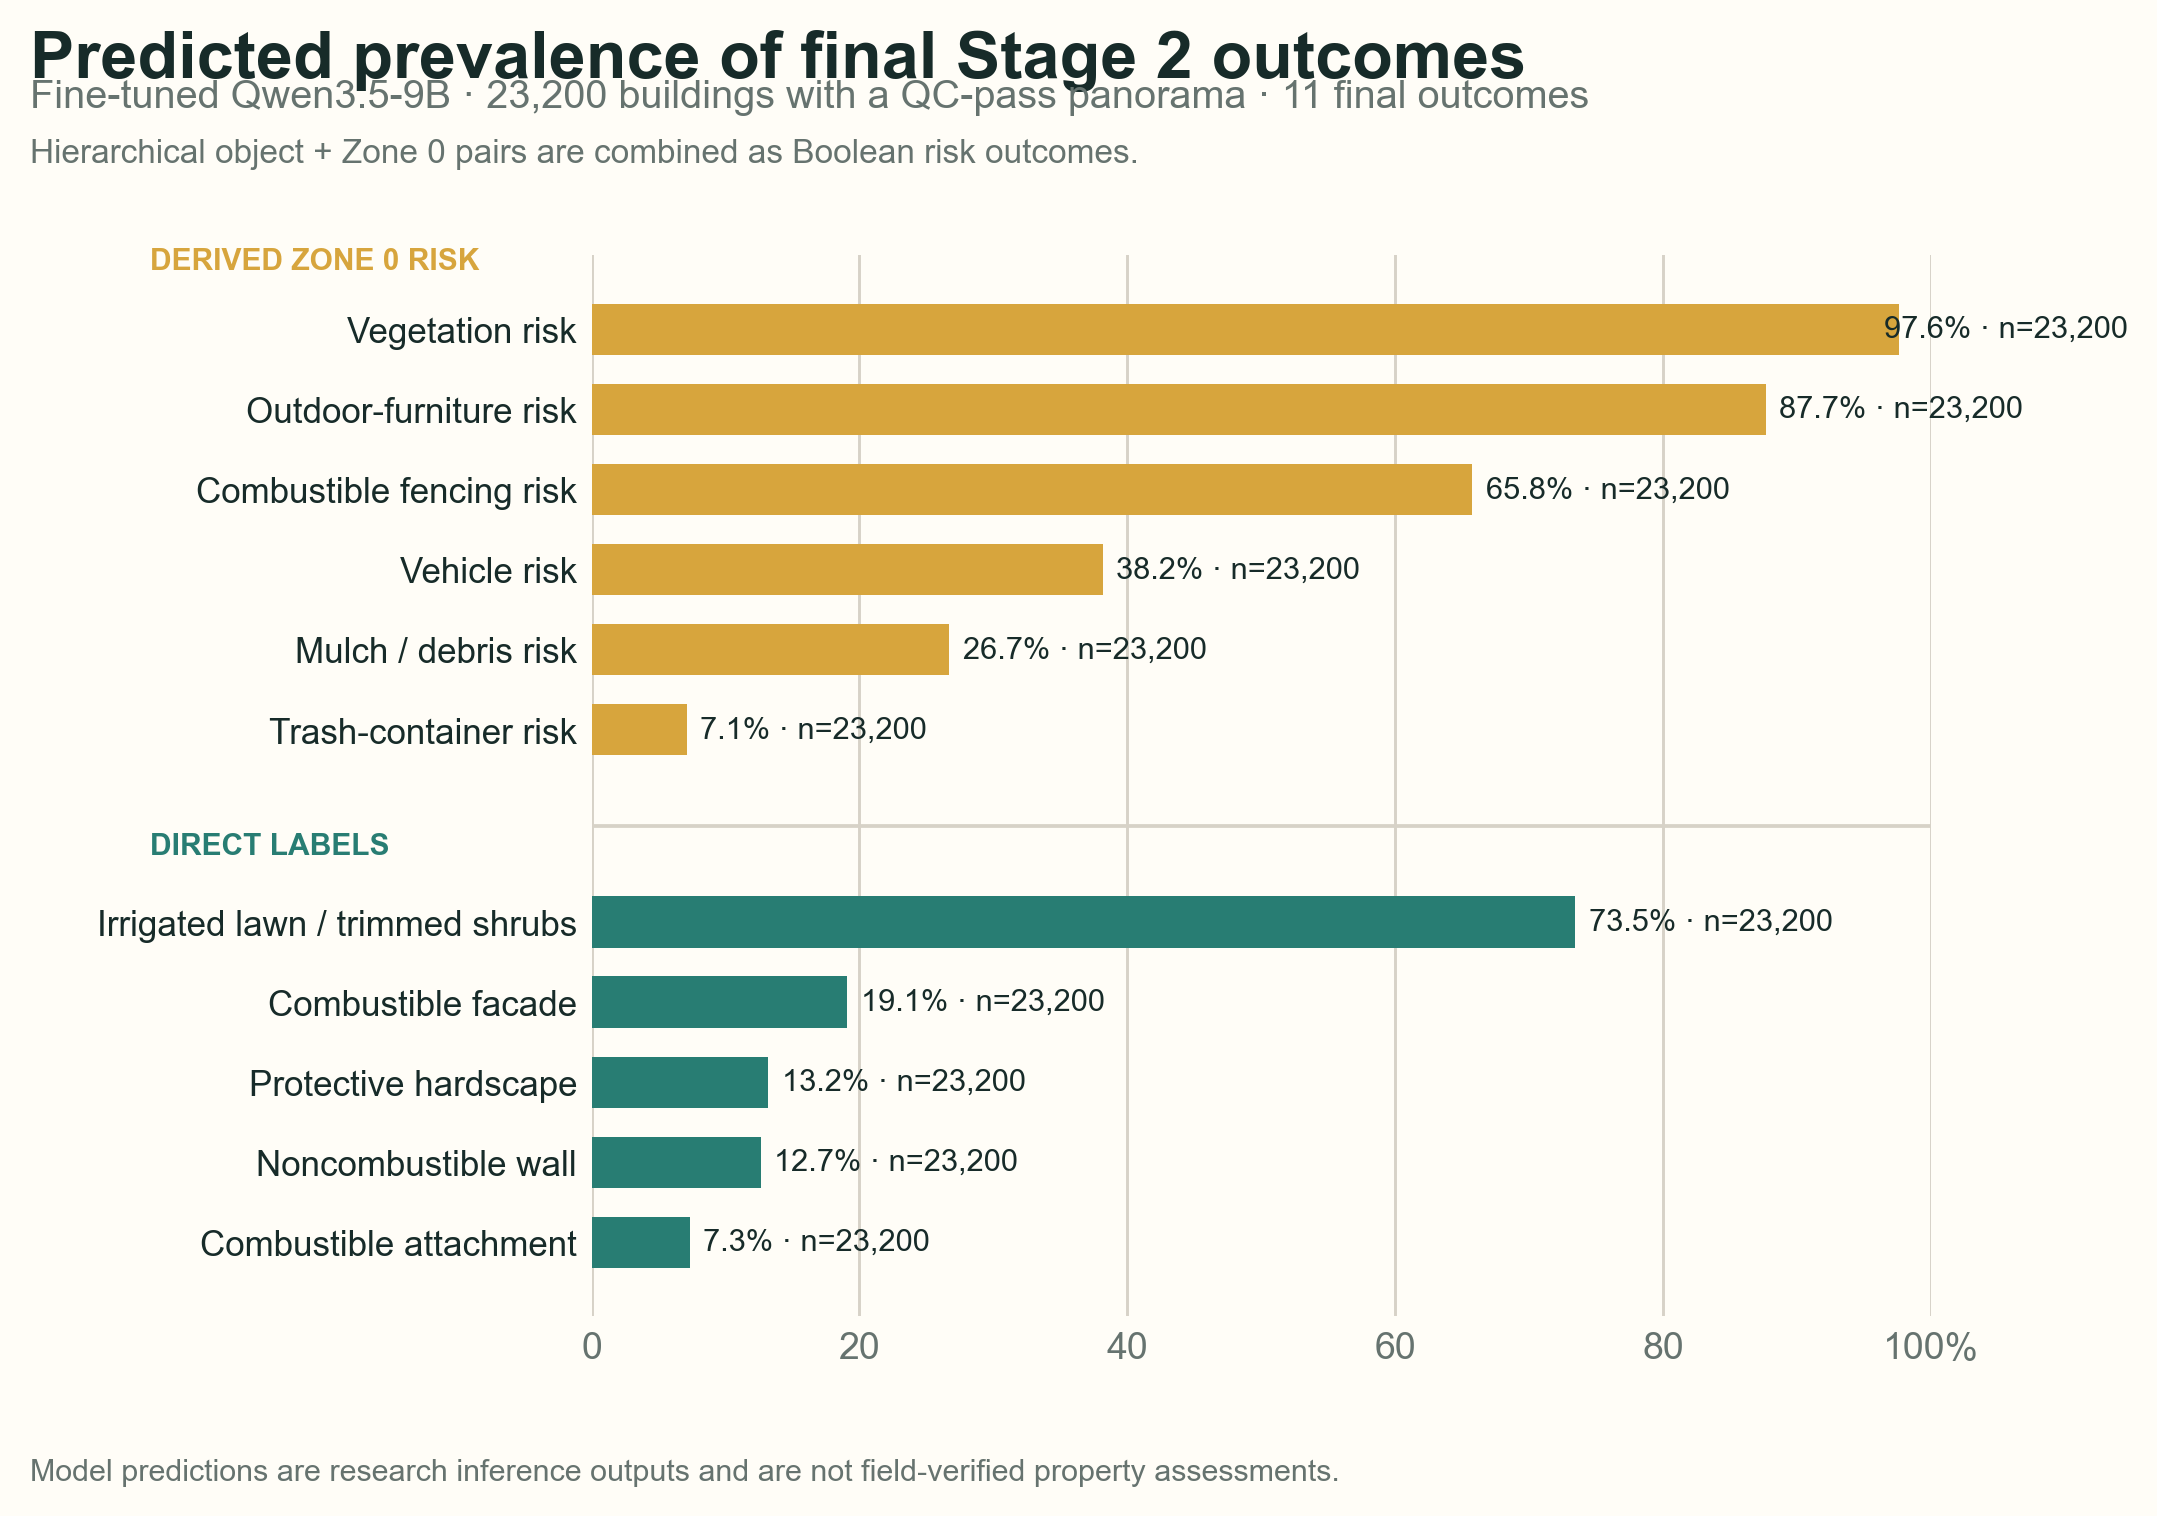
Population coverage and predicted label prevalence